 By Thomas Hawkins | August 21, 2019
Cashout leakage, a long-standing problem in America’s defined contribution system, is a silent crisis that unnecessarily robs millions of Americans of a comfortable, timely or secure retirement. Plagued by misunderstanding and neglect, it’s vitally important to understand the problem and to take decisive action to curb it. The third of a five-part series, this article addresses the magnitude of the 401(k) cashout leakage problem.
You’re Not Thinking Big Enough
If you believe that you already fully comprehend how big the problem of 401(k) cashout leakage is, you may be thinking too small. To grasp the magnitude of 401(k) cashout leakage, you’ll need to expand your mind and think bigger, as in Carl Sagan “billions and billions” big. But remember, although the leakage problem is massive, so is the opportunity in solving it.
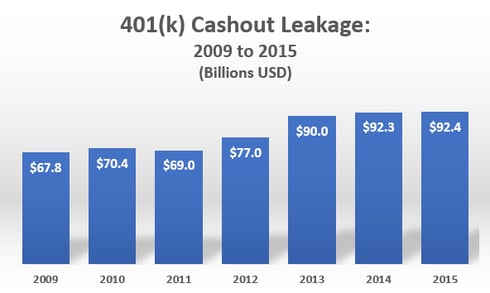
In an Issue Brief published 8/15/19, the Employee Benefit Research Institute (EBRI) released new 401(k) cashout leakage figures, pegging annual cashout leakage in 2015 at $92.4 billion.
Before addressing the magnitude of $92.4 billion in cashout leakage, let’s establish the figure’s credibility. The new estimate was generated by EBRI’s Retirement Security Projection Model (RSPM), which relies upon the EBRI/ICI 401(k) Database – consisting of proprietary data from participating recordkeepers. The database includes details on 27.1 million participants in 110,794 plans, covering 49 percent of the universe of 401(k) plan participants and 44 percent of 401(k) plan assets.
In fact, at Retirement Clearinghouse (RCH), we found the newest EBRI cashout leakage values so credible that we’ve decided to reset our National Retirement Savings Cashout Clock, increasing the annual cashout rate by over $24 billion.
The chart below indicates EBRI’s leakage estimates from 2009-2015, which have increased every year except 2011, when they dipped slightly.
Chart 1: EBRI 401(k) Cashout Leakage Projections
Dare to Compare?
$92.4 billion is a lot of leakage.
- It’s greater than the gross domestic product (GDP) of 147 countries and 13 U.S. states.
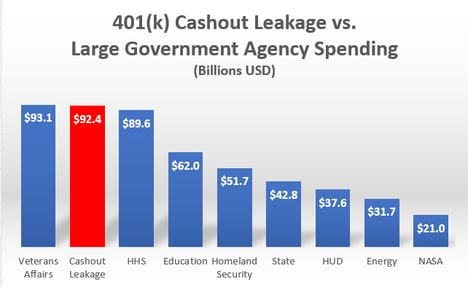
- It’s greater than the amount that the U.S. federal government plans to spend in 2020 on 7 large government agencies and is only slightly less than the projected expenditures on Veterans Affairs ($93.1 billion).
Chart 2: 401(k) Cashout Leakage vs. Projected 2020 U.S. Government Spending
- It’s 185% greater than the amount the United States spent on the New Deal ($50 billion) from 1933-1940.
You may take some comfort in the fact that, although $92.4 billion is a very large number, it’s exceeded by the number of stars in the Milky Way (100 billion) and the number of galaxies in our universe (also 100 billion). But it’s close enough.
The Opportunity to Address 401(k) Cashout Leakage
At a minimum, the new EBRI figures above should convince you that addressing 401(k) cashout leakage is an important retirement savings public policy initiative.
Fortunately, research indicates that approximately two-thirds of 401(k) cashout leakage is avoidable, and is not due to a financial emergency. Therefore, policy initiatives that effectively reduce cashout leakage could deliver significant benefits. For example, the EBRI Issue Brief providing the new figures on cashout leakage also presented the potential benefits of auto portability, which EBRI estimates to be $1.5 trillion (for accounts with balances less than $5,000), or $2.0 trillion for all balances. These projected benefits are a direct consequence of stemming cashout leakage.
In the final two installments of this series, I’ll evaluate the public policy options that offer the most promise to address 401(k) cashout leakage.
Back
 1916 Ayrsley Town Boulevard